I recently joined Research IT from a Java developer role within the University of Bristol. I was eager to learn new skills, including Python – the primary language used by my new team. I spent a couple of months helping out with existing projects and experimenting with tools like Pandas, Jupyter, and Leaflet, and getting familiar with Visual Studio Code’s native support for Jupyter Notebooks which provides a great environment for Python based data experimentation (REPL style). I was then asked to work on a new data visualisation project for Dr Thomas Larkin with network graph data edge and node data prepared by James Thomas and Matt Chandler of the Jean Golding Institute.
I was given a small collection of CSV files containing business data about Augustine Heard & Company and related companies from the mid-nineteenth century, primarily operating in and around China. The dataset included career histories of employees, partners and companies. The employees in the dataset often worked in a particular role for a period of time before switching to a different role or moving to a new location. In addition, many of the companies we were looking at operated in multiple locations. Furthermore, the dataset revealed that new companies would sometimes appear while old ones would disappear. Our goal was to create a proof-of-concept visualisation to help us analyse the relationships between the various entities, showing migration patterns and social networks, we wanted to demonstrate changes over time and how the networks expanded and contracted.
Network Graphs: NetworkX
I started using NetworkX, following a recommendation from my colleague Mike Jones and worked through tutorials with the Panama Papers dataset (see: Exploring the Panama Papers Network). I gained an understanding of network graph theory and repeated the tutorials with our Augustine Heard & Company data. Pandas helped me split the data into years and create network graph images for each year. Although I was happy with the initial network graph images I created, I felt they could be improved further. Despite trying various layout options in NetworkX, I couldn’t quite get the graphs to look as visually pleasing as I wanted them to.
NetworkX network graph plot
Network Graphs: D3
That’s when I came across a great example of a browser-based network graph using the D3 JavaScript library (See Mike Bostock’s work: Force-Directed Graph and associated GitHub Gist). I realised I could reuse the Jupyter scripts that I had used to create the NetworkX-based network graph images to produce the JSON needed for a D3-based network graph for each year. The D3 versions of the network graphs were a significant improvement over the NetworkX image equivalents and much more visually appealing. I think the layouts in NetworkX spring layout and D3 force directed graphs are both based on simulated force interactions between the nodes. I just found D3 easier to work with.
Equivalent D3 network graph plot
Geospatial Visualisation
Leaflet, Mapbox GL JS, D3 Force simulations, SVG overlays and GeoJSON
Although I didn’t initially plan on making the visualisations interactive or web-browser based, I found that the easiest way to integrate maps into my work was by using a web-based mapping platform such as Google Maps or Leaflet. I started experimenting with the Timeline plugin for Leaflet, which allowed me to create dynamic maps that highlighted active locations during specific time periods. To do this, I used an enhanced version of NetworkX called GeoNetworkX to create static GeoJSON data files. While this resulted in an attractive output that listed person and company details in a panel down the side, it still wasn’t a network graph. Despite this, the overall result was still impressive and served to motivate me further in the direction of maps.
I was eager to combine the network graphs I had created with NetworkX and D3 with a browser-based map, but I was unsure of how to do so effectively. The data presented the challenge of many nodes being located at the same positions, leading me to experiment with clustering using the Leaflet timeline I had previously used. However, clustering did not feel like the right solution.
I began to explore the integration of network graphs with a map with only the company and location nodes, temporarily ignoring the people nodes and time axis. To achieve this, I researched Mapbox GL, which offers interactive 3D maps at low zoom levels. I experimented with different display options for multiple companies operating in the same location, including random and circle-based jitter. Although this approach mostly worked well for company/location data, the inclusion of people nodes made it unworkable.
I then focused on overlaying the D3 network graphs I had previously created onto a map. I experimented with both Leaflet and Mapbox GL JS, both of which support overlaying data onto an SVG layer. However, as I did not have all the geographic data needed upfront to produce static GeoJSON files, I needed to use D3’s force simulation to generate geographic locations for company and people nodes. I was able to pin the location nodes to their positions on the underlying map and use the D3 force simulation to determine the best positions for the remaining nodes. Transforming between the coordinate systems used by D3 and the geographic coordinate system used in the map accurately required some experimentation.
2D Network graph on map
I initially wanted to use Mapbox GL JS’s 3D maps, but overlaying 2D representations of data in an SVG layer onto a 3D globe required complex mathematics that was too challenging for a prototype proof-of-concept. My early efforts had paths connecting nodes passing through the earth’s surface, highlighting the need for a thorough understanding of Geodesy mathematics when dealing with coordinates on a globe’s surface. I then realised that I now had all the geographic coordinates generated by D3, allowing me to produce complete GeoJSON data. Both Leaflet and Mapbox GL JS support GeoJSON, and the 3D geographic mathematics needed to overlay the GeoJSON data onto the map was already incorporated into Mapbox GL JS. Therefore, I shifted from overlaying data on an SVG layer to dynamically generating GeoJSON and using that to display the data on the map. After successfully overlaying the network graph onto the 3D globe with Mapbox GL JS, I further improved the visualisation by adding simple filtering based on some data attributes.
Network graph on map with filtering
Immediate neighbours
Tom asked if it was possible to make it so that when we select a node, we only see that individual’s immediate network. I found a solution implementing that Interactive Networks with NetworkX and D3 and implemented it on my examples. It provides a useful focus on the individual when there is a large web of overlapping connections.
Immediate neighbour highlighting
To better focus on the individual, I removed the company and location nodes and used another D3 force simulation, force clustering, to position the people nodes around their corresponding locations. I was even able to colour the nodes based on the various attributes and generate a dynamic key for better understanding.
Community detection
Finally, I also integrated a couple of community detection algorithms, network clustering and Bron Kerbosch. These algorithms helped cluster nodes together based on their connections, enabling the identification of communities within the data. Overall, these improvements helped make the visualisation more interactive, informative, and pleasing to the eye.
I approached the task with an open mind, uncertain about the final form of the data visualisation. Ultimately, I decided to create an interactive web-based approach, which made sense given my past experience. However, I encountered several challenges during the experimentation process. Although there was plenty of helpful information online, much of it pertained to NetworkX 1.x, which was popular about eight years ago. NetworkX 2.x is substantially different, and NetworkX 3.x came out just after I completed this project. Similarly, D3 had a very active community with numerous examples hosted on GitHub Gists and deployed using “bl.ocks.org,” but these have now been replaced by Observable.com. Furthermore, code written for D3 versions prior to version 5 was markedly different from later versions, and most example code I found was for older versions. Despite these version difficulties, I’m pleased with the final result.
I’ve been lucky enough to have the opportunity to collaborate with the Beyond 2022 project. I’ve been helping historians and archivists on the project develop a TEI/XML schema that will be used to encode a modern English translation of original Latin documents. These documents include receipt rolls from the Irish Exchequer, something I’m familiar with after working with Prof. Brendan Smith at the University of Bristol. Part of the encoding includes marking up dates in the documents in a format that can be read by computers, and this blog post describes how I wrote a plugin for the Oxygen XML editor in collaboration with Dr Elizabeth Biggs, a researcher at Trinity College, Dublin, and The National Archives (UK), to make this process easier and less error-prone. It is a nice example of how a Research Software Engineer can make a positive contribution to a Digital Humanities project.
The problem: dates are hard!
In official records, such as the Irish Exchequer receipt rolls, dates are given as regnal years, meaning a date based on the current year of the English monarch’s reign. For example, 5 Henry VI means the fifth year of Henry VI’s reign, and this has a date range of 1 September 1426 (the date of Henry’s accession to the throne being 1 September 1422) until 31 August 1427. Thus, a date of 29 September 5 Henry VI would be 29 September 1426. Of course, it is more complicated than that, since a date would rarely appear as 29 September, but rather based around a feast day which, in this case, is Michaelmas. Some feast days like Michaelmas are fixed, meaning they always occur on the same date. So, Michaelmas 5 Henry VI and Michaelmas 6 Henry VI are the 29 September 1426 and 29 September 1427, respectively.
However, Easter, and feast days anchored to Easter, are movable, i.e., they are on different dates each year. The calculation of Easter, called a comptus, is complicated but often described as occurring on the first Sunday after the first full moon after the spring equinox (21 April). Thus, Easter 5 Henry VI occurred on 31 March 1426, while Easter 6 Henry VI occurred on 20 April 1427. Some dates of feast days are linked to Easter: Ash Wednesday occurs 46 days before Easter and marks the start of Lent. In contrast, Quinquagesima occurs on the Sunday before Lent, while Rogation Sunday occurs on the sixth Sunday after Easter.
To make things even more interesting, the date might be described as the octave or quindene of a feast day, being the eighth and fifteenth day after a feast, respectively, though because the first date is always calculated this essentially means a week or a fortnight in modern terms. In addition, ‘eve’ and ‘morrow’ might be added to indicate the day before or day after.
The classic reference book for working out historical dates is C. R. Cheney’s Handbook of Dates for Students of English History. First published in 1946, now in its second edition revised by Michael Jones, it has remained in print ever since. The book provides a list of regnal dates for each monarch and a table for each calendar year that can be cross-referenced for the date of Easter and other major liturgical feasts. There is also a comprehensive list of feast days.
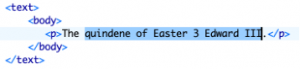
In the TEI/XML we want the date in the YYYY-MM-DD format, with appropriate markup around the date given. For example, “quindene of Easter 3 Edward III” we will want the following markup:
<date type="regnal" when="1329-05-07">quindene of Easter <supplied>1329</supplied> 3 Edward III</date>
So, the modernised date is given in the @when attribute. We keep the original text but add the year (1329) provided in a tag to indicate it’s an editorial addition.
Looking up the date and adding all this additional markup, in addition to translating the original Latin into English, was going to be time-consuming and prone to errors. It was agreed that it would be worth spending some time developing a plugin for the Oxygen XML editor to see if it could improve the accuracy and time in adding dates into the TEI/XML documents.
The solution
I developed a Java library called RegnalDate that can parse a string of text to look for a regnal date and return an object that represents that date. I also wrote an Oxygen XML plugin called RegnalDatePlugin that sends text to RegnalDate and then takes the object returned by the library and creates a TEI/XML <date/> element in the document being edited.
The plugin I developed uses several lookup tables internally. For the regnal years, we are only dealing with Henry III to Henry VII, the principal monarchs that the Gold Seam will be dealing with. Since I knew the start date of each monarch’s reign, I wrote a simple Python script that created a lookup table that has many rows that looked like this:
hen-3-1:1216-10-28:1217-10-27
Which basically says that 1 Henry III runs from 28 October 1216 to 17 October 1217.
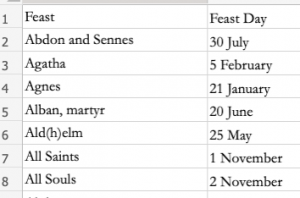
For the feast days most likely referenced by the Irish Exchequer, Elizabeth Biggs sent me a spreadsheet of fixed feast days as they will appear, e.g., ‘All Saints’, and the date they occur.
Another Python script processed the spreadsheet to create a new lookup table with entries that looks like this:
All Saints:11-01
Here I know that All Saints occurs on 1 November each year.
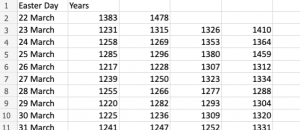
Elizabeth also sent me a spreadsheet of dates between 22 March and 25 April and what years Easter occurred on that date.
And she also gave a list of movable feasts used by the Exchequer and how many days before or after Easter they occurred.
These were again processed by a Python script to create a third lookup table that, for each year between 1216 and 1509 (the calendar years that cover our regnal year range), we have the date of Easter and the movable feasts. For example:
In 1216, Easter occurred on 10 April, while Quinquagesima (Sunday before Lent) was on 21 February, Shrove Tuesday was on 23 February, etc.
RegnalDate was written to take a piece of text, e.g., ‘quindene of Easter 3 Edward III’ and parse it to break it down using regular expressions (pattern matching) into its component parts so that we can use the lookup tables described earlier. The three things we are interested in here are the regnal date (3 Edward III), the feast (Easter) and the modifier (quindene). By parsing this way, we can work out the date of Easter, 23 April 1329, and then add 15 days for the quindene, which gives us 7 May 1329.
In the Oxygen XML Editor, the editor of a document just needs to highlight the text, hit the command CTRL+SHIFT+R, and the RegnalDatePlugin will use RegnalDate to parse the text and supply the TEI/XML needed.
Here are some screenshots of text before and after the plugin was used.
Before:
After:
To ensure that both the lookup tables and parsing process are correct, I have a series of tests that check that I’m getting the expected results for different feast days and regnal years. So that I wasn’t marking my own homework, Elizabeth also sent me a number of regnal dates with their corresponding calendar date, and my code correctly parsed these as well.
Some thoughts
This project represents a nice collaboration between a Research Software Engineer, historians and archivists, providing a tool to improve the quality and efficiency of an editing process. After a recent meeting with the Beyond 2022 team, I was pleased to hear that Elizabeth had been successfully using the plugin. The plugin was written relatively quickly, and after re-reviewing the code, it could do with some refactoring to make it easier to read and be more efficient. A process that can be done with some confidence due to the test suite. It could also be updated to include other English monarchs, although I have reservations about King John, whose regnal years start on Ascension Day … a movable feast!
To celebrate the first International Research Software Engineers (RSE) day our team wanted to promote becoming an RSE as a career path and raise awareness of Research Software Engineering in general. We think it’s one of the most diverse and exciting technical disciplines and hope this blog post might convince you to think the same.
What is an RSE?
Defining the role of a Research Software Engineer is difficult as it’s an exceptionally varied role that differs between research institutions. Its breadth is best captured in the definition provided by the Society of Research Software Engineering:
“A Research Software Engineer (RSE) combines professional software engineering expertise with an intimate understanding of research.”
Source: https://society-rse.org/about/
In our team the RSEs design, create, deliver and support technical solutions enabling research projects at the University of Bristol. These aren’t the ancillary services to facilitate research (such as finance systems etc) but technical solutions that directly deliver research outcomes. For example, creating an iPad app that a research team uses with a study group as part of their research. In addition we work with academic colleagues to help them with the grant application process. This work involves requirements gathering, the creation of technical estimates and writing data management plans that form part of their research funding submission.
Why be an RSE?
So, you’re interested in research and software engineering? Let me try and convince you that becoming an RSE is the career for you:-
Interesting and novel projects
You’ll work on diverse and interesting projects. Any academic at the University of Bristol can contact our team and ask us to be involved in their research. That means we have an exceptionally diverse range of projects we’re working on. These range from engineering to history and from medical research to the impacts of climate change. Most importantly, these are research projects and so are novel applications and things that have not been done before.
Technical freedom
All developers love a bit of technical freedom… the flexibility to learn something new and to be able to use the “right tool for the right job”. Research Software Engineering allows a lot of flexibility because not only do you need to pick the “best of breed” solution for any given problem to demonstrate value for money for funders but our research projects have a finite timespan. In most cases this is several years but for proof-of-concept work this could be just a few months. This known lifespan means that we have flexibility to try out new things if they are appropriate to that project.
RSEs come from varied backgrounds
Research Software Engineers come from a variety of backgrounds because it’s a very flexible discipline and you don’t need to come from a conventional computer science background. Many academic disciplines help develop strong data handling and programming skills and these can be discipline specific which makes them invaluable in a research software engineering team. Also, if you have some research experience then this makes you better able to help with the grant application process, contributing to academic publications and in understanding research outputs. Our RSEs have a diverse mix of backgrounds and experiences (many switched careers to become RSEs) and this is of huge positive benefit to the team. In my case, for example, I do not have a computer science background and am a self-taught programmer. I have a strong interest in software development but when doing field work on flies (Lucilia sericata – check them out, they’re cool) I wouldn’t have dreamt that years later I’d be writing software to help children with eye movement issues or creating online games to help explain bird flight research.
Development for social good Academic research furthers human knowledge so RSEs get to work on projects that are delivering clear benefits. In some cases there are obvious direct benefits such as our mobile app to help assess earthquake risks to school buildings in Nepal. In other cases our work involves making something available to people that has never been available in that form before. For example, the MPESE project that made the hidden archive of early Stuart England’s manuscript pamphlets available online.
We hope that this fairly brief blog post has helped raise the profile of RSEs and maybe even convinced you that you might want to become an RSE. If you want to know more than here are some useful links:
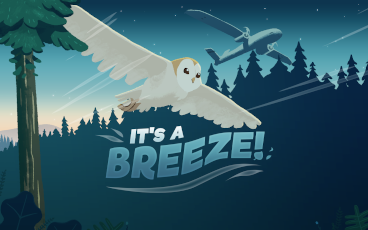
At the end of February, researchers from the University of Bristol’s Bio-inspired Flight Lab and Royal Veterinary College (RVC) approached Research IT to see if we could produce a web game for their part in The Royal Society’s Summer Science Exhibition. The exhibition was to run between the 8th-11th July, but all content needed to be finalised and made available to The Royal Society by 10th June. After initial meetings Research IT developed an estimate and very rough storyboard.
Example images from the game storyboard
The aim of the game was to allow players to adjust parameters of a bird’s wing to improve how the bird copes with a gust of wind.The first two levels allow the player to change a bird wing and see how this affects the flight. After this, a third level has the player designing a wing for an unmanned aerial vehicle to show how research with birds helps in designing aircraft wings. The game is backed with real data generated by the research team from their wind tunnel experiments with real birds and computer simulations.
Technology selection
The Research IT team use common “toolchains” across many of our projects, but it was obvious that this project was going to require us to “skill up” in something new.
The way we approach tool selection is not unusual, we list the core functionality we’re looking for, compile a list of possible tools and assess them against the requirements. For this project we didn’t have time to do this in great depth or create any example projects etc. However, even a rapid critical review at this stage can pay dividends later. Not having a long time to do this can be beneficial as being able to rapidly get information from documentation is also an important consideration.
The requirements we looked for were:
Desktop and mobile support
Translation (i.e. movement) and rotation of objects
Scaling of objects
Scenes (support for levels)
Support for spritesheets
Particles and trails
UI controls – specifically sliders and buttons
Support and documentation
Licensing/cost
I’ve written games before in a variety of tools and, in the (distant) past,I would’ve used Abode Flash for this project but that’s been dead for some time. I have experience of “heavyweight” games engines such as Unity and Unreal and both can be used to create games that can be played in the browser (using WebGL and WebAssembly). Even though you can create 2D games in these 3D engines we decided it would be better to create “It’s a breeze” in a JavaScript games engine as we were more likely to be able to deliver something high quality in the required time. We then compiled ashortlist of tools we wanted to lookat:
The final choice came down to Phaser and PlayCanvas with both clearly capable of delivering what we needed. We settled on Phaser due to the number of tutorials available, very active community and because PlayCanvas uses a custom editor which would require us to learn this as well as the tool itself. PlayCanvas looks like a very capable library but given the short timescales, we needed to minimise the number of new things to learn.
Phaser uses the concept of “scenes”, each scene defines the sections of your game and might include a welcome scene, the scene for adjusting the wing settings or a scene showing the bird flight etc. Each scene has its own game loop and, if you’ve written games before, you’ll know that game loops define the flow of your game. The game loop is where you’ll move objects, do hit detection, play particle effects etc. Phaser’s game loop runs at a default rate of 60 frames per second. Phaser also has the ability to scale the game automatically to fit the screen resolution which makes supporting a range of devices much easier.
The tool selection process happened alongside work to refine what the game would include and the research team generating data for us to work with for two bird levels and one aircraft level. The data and core game mechanics were largely finalised by the 19th April which left Research IT seven weeks to create, refine and deliver the game.
Working with short timescales and a strict deadline
The Research IT team commonly work on projects using a Scrum methodology and (usually) sprints of two to four weeks. In this case the short, fixed, timescales meant that our ability to review and iterate was going to be compromised and shortening sprints to one week would, we felt, require a disproportionate time commitment from the research team (who not only have teaching and research commitments but also needed to produce other resources for the exhibition). Scrum is a great methodology but can break down when working to very short, fixed, deadlines because fixed deadlines affect your ability to iterate and, when sprints are very short, the amount of time needed for the various review and planning meetings becomes disproportionate to the development time. Within the team we still organised the work into sprints but relaxed requirements around the review and planning meetings to fit the time
In addition to work from the researchers and Research IT, the artwork for the game was being created by Tom Waterhouse from 2DForever but this wouldn’t be finalised until later on in the development process.
With this in mind, and because we were using a new toolchain, Research IT created placeholder artwork using Vectr so that we could develop the game and provide the researchers with something to play before the final artwork was available.
Screenshot of the prototype game showing the placeholder artwork
Fast prototyping may not create something pretty but allowed us to get to grips with Phaser, gained familiarity with the data from the researchers and allowed the researchers to see how the raw data would affect on-screen visuals. This allowed the research team to refine the game ideas and model settings to make the impact of the wing changes clearer to players.
Once the artwork was finished, we would be able to replace the placeholders and, in theory, there should only be minimal adjustments.
As things turned out, replacing the placeholder artwork was reasonably straightforward but we did need to adjust factors in the game to give the best experience once the artwork was in (for example, making sure the trails lined up with the wings). As part of the prototyping process I’d made it easy to adjust flight speed and vertical movement and this made the adjustments easier to do than if I hadn’t built in this flexibility from the outset. The game prototype also showed that players would need to be shown a demonstration flight before they adjusted the wings and this would form a good introduction to the game. We were able to use a lot of the code from the prototype in the final game and the prototype also allowed us to test out the game ideas early on and without being concerned about how the game looked. This really helped us refine the game and was a critical factor in us successfully meeting the deadline.
Game screenshot showing the final artwork (using the same wing settings as in the prototype screenshot shown previously)
Managing server load
The Royal Society Summer Science exhibition is normally held in person and attracts more than 10,000 visitors over the week but was not held in 2020 and was online only this year. Content from the researchers invited to take part had to be hosted externally and not by The Royal Society so we needed to host the game on our existing infrastructure but without knowledge of the traffic to expect; we did ask but this was the first time they were running the exhibition online.
No developer wants to optimise prematurely but as the exhibition runs over a four-day period (two of which are over the weekend) we had to take some reasonable optimisation steps in advance as our ability to make rapid changes during the exhibition itself would be low. Our priorities would be to minimise the amount of content players would need to download and minimise the number of requests that browsers would need to make. Browsers are limited on the number of concurrent requests they can make to the same hostname (commonly between 6 – 13 depending on browser). The fewer requests that are needed and the faster we can serve a request, and move on to the next, the better. Aside from basic changes such as configuring caching and the web server gzipping content there were several other things we did to make sure the server could handle the load during the exhibition:-
Minify JavaScript – this is an easy task but minifying the JavaScript code of the game reduced its size by around 45%. Smaller files download quicker.
Minimise HTTP requests – in addition to the concurrency limit there is an overhead for any request (TCP handshake, headers being sent etc) so a lot of requests for small files can really mount up for the server handling the requests. We can minimise requests in several ways, but texture packing is one that gives big benefits for games. Texture packing involves combining many small images into a single larger image, for example, all the artwork for the side-on view for the owl with different wing positions. A corresponding JSON (JavaScript Object Notation) file tells the games engine the positions of the images within the larger image and these are unpacked by the games engine. This means that instead of requests for, say, 15 individual images, the browser just makes two requests (one for the large image and one for the JSON).
Benchmarking the web server – using a JavaScript games engine meant we could host the game on our existing “static” web server by creating a new Apache virtual host. However, we wanted to know what performance we could expect from the server, so we benchmarked it using ‘ab‘. Other tools, such as ‘Locust‘ exist but in this case ‘ab’ was good enough for our needs and easily available. Benchmarking the server at the outset showed it could serve around 50 requests per second (benchmarked with 1000 requests with up to 200 concurrent requests). Jon Hallett and I made a few server changes followed by more benchmarking and Jon found that the bottleneck was ‘MPM Prefork’, and not the number of workers, so we switched to ‘MPM Event’ and the benchmarks increased three-fold so that the server could handle around 150 requests per second.
Reducing file size – the game runs client-side so the smaller the files the faster they transfer and the greater throughput of requests the server can handle as they aren’t hanging around as long. After I’d created the packed textures Tom was able to reduce their file size by around 70% by converting the images to 8-bit PNGs without me needing to regenerate the JSON files.
Using a CDN – we don’t have access to a centrally provided CDN unfortunately. However, as we were using the popular Phaser games engine this was available via cdnjs from Cloudflare so we could use that for the main library at least. Using a separate hostname also increases the number of concurrent requests a browser can make as the limit is per hostname.
The changes meant the game was delivered in ~45 requests (including all game code, artwork, sound, CSS, fonts etc) for a total download of ~2.8Mb in less than a second (assuming a reasonable connection). This content would then be cached so, if players returned to the game later, they wouldn’t need to download the assets again.
Testing
Anyone that’s been to a talk by our team knows we’re big fans of automated testing and, although testing games is difficult, we wanted this project to be no exception – it provided an opportunity for us to try out automated “visual testing” and the knowledge gained will benefit future projects.
Testing traditional web applications is easy (no excuses) and your aim is always to remove as much manual testing as possible. We write unit tests, integration tests (utilising a test client) and acceptance tests (usually running in headless browsers). In the case of integration tests and acceptance tests it’s easy to check the content of the resulting web page to determine what’s being shown to the user even if that’s being created/manipulated with JavaScript. In the case of web games, the issues become more difficult. The games engine is rendering your game (often using WebGL) within an element on the page but unless it exposes the content (which isn’t traditional web content etc) in some way it’s hard to test directly. For example, we need to be able to test that a particular sprite (the image of the owl for example) has been shown on-screen in a specific position in response to actions of the player etc.
One way to do tests but avoid the issue of what the games engine allows you to test directly is to use visual testing. This involves running and interacting with the game programmatically via a headless browser by ‘feeding’ it locations (in pixels) of where to run a click event (e.g. simulating a mouse click or a tap event on a phone) or performing key presses etc. So, we program the headless browser to act like a human would (without the unreliable human being involved) and it plays through the game. At points of interest in the game you get the test framework to take a screenshot of what is shown in the browser. By generating a set of “known good” reference images then the test can run through the various scenarios in the game and do a pixel-by-pixel comparison between the reference image and an image taken during the latest test run, if discrepancies are found the test fails.
The team is currently moving away from Selenium as our acceptance testing tool and adopting Cypress for new projects. Cypress comes bundled with Electron which includes the Chromium browser (but you can also use Firefox, Chrome and Edge) and there are several third-party plugins for visual testing. Some of these use an external service to do the image comparison but that introduces external dependencies and we want to be able to run this offline as well as in our Continuous Integration (CI) setup. So, we used the cypress-image-diff plugin with Cypress running in a Docker container and running the tests against a copy of the game running in another Docker container using an NGINX server. We can then write tests that run through various success and failure scenarios within the game and confirm that not only can the user interact with the game but what’s shown on the screen is what we expect… so we’ve got end-to-end testing with no humans involved and that’s perfect!
Or is it?
Predictable games may not be fun. Even in an educational/academic game such as this a bit of randomness gives more interest. For example, the particle emitters we use to create the gust animation or the smoke from the volcano are different every time you play the game. If we’re doing a pixel-by-pixel comparison then we’re going to get false negatives in our test results on any scene with an element of randomness. To alleviate this we set a threshold based on the percentage of variation we’ll accept between the screen shots. For example, the particles account for around 20% of the screen so we allow this amount of variation to avoid false negatives.
Results of a failed visual test showing the Reference image, comparison image from the test and the “diff” image highlighting where the pixels differ.
Automated testing is invaluable in any project but, with a project of this nature, we also needed to do a lot of device testing. Testing on the browsers you can run on your laptop or via the Remote Desktop will only get you so far and testing on a range of mobile devices is difficult aside from your own personal device and those of friends and family. Research IT has a Browserstack subscription for exactly this reason so we can do device testing on genuine devices (not emulators) even with code that’s only running in a local environment. This enabled us to test the game on a wide variety of operating systems and browser combinations as well as on a wide range of mobile devices.
Accessibility
Accessibility is a fundamental right and a legal requirement under the Equality Act 2010 so it’s important to make sure we don’t introduce barriers for users. Highly interactive content such as online games pose a greater challenge than more simple content such as traditional web pages. We did several things to make the content as accessible as possible and these changes provided benefits for all users and not just those with a disability affecting their use of the web:-
Colour choice – the colour palette and contrast levels should mean people with colour blindness or other visual problems would be able to read the text and see the wing trails clearly. The path of the trails and line thickness also means that if the user cannot differentiate between the colours it is still unambiguous which trail relates to the bird’s body and which to the wings.
Keyboard controls – not everyone can use a mouse, so it is important to provide keyboard controls. The game can be played without the use of a mouse and, on ‘tabbing’ to give the content focus, the keyboard controls are shown to the player.
Sound toggle – users with cognitive issues may find sound distracting so we added functionality to allow users to disable sound.
Large ‘hit’ areas – the user interface of the game has large buttons and big ‘hit’ areas and this benefits people with motor control or dexterity issues.
Alternative version – it’s not possible to make content like this accessible to all users in all situations. For example, a user may have several issues that combine to pose significant difficulties. To allow these users to access the content we created a web page version of the game that explained several scenarios and presented similar information to that available within the game.
Help page – we also produced a help page for the game covering browser versions, keyboard controls and a link to the alternative version of the game.
Conclusion
This was a fun project to work on, Tom’s artwork was amazing, the project included some interesting challenges and had an international reach that helped showcase the work of researchers at the University of Bristol. During the exhibition, the game was featured in press releases and social media posts from the University of Bristol, RVC, The Royal Society and on aviation websites (e.g. BlueSkyNews).
From a technical perspective, Phaser is a mature and extremely capable library and enabled us to deliver the game on time and with a high degree of confidence that it would work well on a wide range of devices. Cypress, once again, proved itself to be an excellent test framework and this project contributed to the testing expertise within the team as we have experience with automated visual testing and that will feed into other projects.
The Research IT team is recruiting for an assistant developer, so we thought it might be a good idea to write a blog post about life in our team and what an assistant developer role means to us.
The job description vs job advert
If you’ve found this post by following a link in the job advert, the University’s official job description might seem a bit daunting. Don’t worry it’s like that because the University is big, really big (there are almost 8,000 members of staff and over 2,000 of those in Professional Services, where IT Services sits) so staff doing broadly similar roles across the university have a shared job description. Having shared job descriptions brings positives and negatives. As someone applying for a role in the university you may find the description lists very broad skills but doesn’t contain much detail about the actual role, work you’ll do or team you’ll be working in. Developers working in our team share a job description with developers in other teams, but the specific type of work we do and the exact skills we need differ in the detail. It’s this detail that defines the role, which we have tried to convey in the advert and in this blog post. So let’s talk about our team…
What do we do?
We are a small team, currently the team is three senior developers, one systems administrator, one database manager working on one very specific project, one administrator and the team leader – we also work with some lovely contractors. Our function is to provide bespoke software solutions to deliver research projects within the University, we create software from scratch and use common frameworks to enable us to do that, but the nature of our function means we are always building something novel.
So, a project lifecycle might look like:
A member of research staff contacts us looking for some technical assistance with a grant application they are writing.
We work with the researcher to understand and refine their requirements and then put together an estimate for the cost and time required to deliver the solution to support their research and fit with the grant requirements.
The researcher submits their application to the relevant funding body. And then we wait…. often months… During this time we work on our other projects that have already been funded.
Assuming the researcher is successful we work with them to create the software to support their research project – the money from this coming from the successfully funded grant. We often work with external designers and usability experts to create the best possible solution we can within budget and use them to provide expertise we don’t currently have within our team.
During the development process we make sure the software adheres to both internal and external governance and legal requirements.
When the software is in use, we provide technical support to the researchers (we don’t normally deal with support from end users directly) for the duration of the project and keep the software up to date.
At the end of the project, we help the researcher extract any data needed for their research (if they haven’t done this themselves) and then the software is either “retired” or passed on to another organisation if it is to continue as a service after the research project.
So, in a nutshell, we create new “things” for researchers and these “things” have a finite lifespan.
The more astute among you will have noticed we’ve not said what sort of things we create and what we use to do that…
What do we create?
Despite the fact that our team is really small, our remit is to work with any researcher who needs our services across the university (and can pay). This means we have to be able to work in a very wide range of disciplines. For example, we currently have projects in Engineering, Epidemiology, Mental Health, History and Geography – and this is just a current snapshot not including past and future projects. Working in such a diverse range of disciplines means a diverse range of solutions and, very broadly, these include:
Data driven websites and applications
Mobile apps
Games/game-like things – web and mobile
Data processing pipelines
Natural Language Processing
Grant funded projects must demonstrate value for money, so we often need to work with the “best of breed” solution in any specific discipline, but we do standardise where we can. It’s not possible to do what we do with such a small team and not have common tool chains. So, a few technologies we commonly use include:
Django web framework
Python libraries like Pandas, NLTK and NumPy
Phaser (JavaScript games engine)
Cordova & native app development
Apache & NGINX
Git
Docker
Jenkins & Bitbucket pipelines
Why our team is special and why you should consider applying
Teams like ours are very unusual outside of a university and are even uncommon within universities. In other development jobs you’ll be working on a specific product or working on multiple, similar projects in a narrow range of technologies. Our team has to be able to skill-up quickly with new tools for a project, so you are always working on something new, learning something and building your skillset. We have a significant amount of technical freedom, and it’s often our decision what tool we use to deliver a specific project. This doesn’t mean we just pick whatever we fancy, but we do have the flexibility to use the best tool for the job at hand. Research projects are finite so we have “end of life” dates for projects and, although this can sometimes be five or more years in the future it does mean we are not left supporting lots of old projects and legacy code.
Also, our projects bring positive benefits. as we build software to support research that increases our understanding of a topic. For example, some of our current work focuses on climate change and mental health in adults.
Who should apply and what will the assistant developer do?
The assistant developer role would suit someone without lots of experience yet, and the range of technologies our team works with means that we’re looking for someone with a willingness to learn new skills and an awareness of development in general rather than specific skillsets.
We’d like you to have some technical experience (for example, some programming knowledge) but don’t want to be prescriptive over what we expect. For example, you may have done things like created and run a small website (perhaps backed by a database) or, written some code in a popular scripting language (for example, Python, PHP or JavaScript), and stored your code under version control and possibly read about or written some automated tests.
In terms of where the role sits within the team, you’ll be working with the senior developers and the systems administrator to help deliver new projects and support our existing projects and processes. You might be asked to make changes to one of our existing projects to keep it up to date, develop some functionality on a new project or work on improving some of our internal systems (such as our automated deployment pipelines, test suites and monitoring systems). The work will be diverse, and you’ll need to show you can pick up new skills quickly.
The job is currently only being advertised internally and you can apply here, if you want to see some of examples of our work then they’re on our website or if you want an informal chat about the role please contact: Serena Cooper, Research IT Team Manager (serena.cooper@bristol.ac.uk) or Kieren Pitts (kieren.pitts@bristol.ac.uk)
Research IT primarily does software development for new services, but there is more to commissioning a new service than just writing code. Behind the scenes, Research IT takes new services through the University’s governance processes, which include the new service process and several change-management steps.
The new service process is an important part of governance in IT Services, demonstrating a service is ready for production use. The process provides assurance that a service meets the University’s needs in terms of fitness for purpose, data protection, privacy and security. It also checks the service will be maintainable over its expected lifetime and that service levels are agreed and support contracts in place.
Completing the new service process involves documenting the service using several multi-page forms. Once documented, approvals are needed from several managers in different areas in IT Services. When approved, the whole lot needs to be taken to at least two meetings of the University’s Change Advisory Board before the service can be recorded in the service catalogue and made live.
The whole process takes a few days of staff time over several weeks of elapsed time. Completing the forms takes a day or two. Coordinating approvals can take more than a week. Steering the new service through the Change Advisory Board usually takes another week or two.
It is quite an undertaking! But it is another area of expertise which Research IT provides to researchers, on top of software development, as part of our offering.
At school, I was the child who sat quietly in the corner, and whose every school report said in some form of words “Claire is very quiet and needs to participate in class discussion more”. It wasn’t that I didn’t have anything to say, it was just that others were more vocal, and discussion always moved at such a pace that by the time there was a gap anything I had to say was out of date. I am an extreme introvert, that’s not to say I don’t like having company or I’m shy, those are very different things. I get my strength from solitary pursuits; music, reading, drawing which in turn enables me to fully participate when with others.
Music has always been a solace for me, whether playing or listening and as a musician one of the biggest joys is performing which is an interesting juxtaposition for an introvert but somehow it makes sense, it’s all a process of exchanging energy. It doesn’t have to be in front of an audience, I swear some of the best playing and singing I’ve ever done has been in an empty church with no one around apart from my accompanist.It’s the process of sharing and communicating with a single purpose, the interpretation of a vision (both the composers and your own), the translation of sound into a feeling, a thought, a memory, of taking listeners on a journey to help them move beyond the immediate.
So, where is this ramble taking us… Like many women in IT I sort of fell into this career, I trained as a librarian and spent my holidays working at a local service provider at the dawn of the internet (UK Online for those interested). It was here that I learned HTML which in turn allowed me to find a job when I left University and faced the stark realisation that there aren’t that many jobs for newly qualified, straight out of school librarians with no experience. I was either not experienced enough for the roles I was qualified for or over-qualified for the more junior positions. Overtime, I progressed from a web developer to a slightly more “hard-core” Perl developer which in turn led me to join the Institute of Learning Technology at the University of Bristol on the 4thof March 2002.
During my time at Bristol, I’ve had the joy of progressing through many different roles which included a return to my original aspirations in a library when I helped support the main library management system. Once the library system had been moved to a 3rd party supplier, I found myself at a loose end. No longer truly a developer and with no desire to become one again I shifted sideways into the Research IT team as a Relationship Manager. The move from a technical role into a more project-based, facilitation role was daunting at first but very quickly I knew I’d found what I wanted to do.
Listening to researchers and delving into their aspirations, interpreting their ideas into a reality, helping them along a journey (you see where I was going with the ramble now?). To me communication in whatever form is vital. The processes of active listening, guidance and requirement clarificationare fundamental elements of any successful project. So many problems and issues can be resolved if we just stop and truly share what we are trying to achieve but also to make sure that we are understanding what others are trying to achieve too. Most importantly be open about that goal and the benefits you hope it will bring and if you don’t understand, don’t be afraid to ask for further information.
My experiences and the skills I have learnt during my time in Research IT and the strong leadership and support of my managers (both female) has given me the confidence to start yet another part of my career this time as a Business Analyst within the IT Architecture Team. I’m going to miss Research ITbut am very much looking forward to introducing a new approach into the strategic projects that can sometimes lose track of the benefits they’re trying to deliverand who they are trying to help. I’ve transitioned from the quiet child in the corner to a capable adult who can (and does) make their voice heard, who will take the lead on discussions and one who I hope builds relationships and bridges across all parts of IT.
Being asked to put together a few words for International Women’s Day has provided me with a great opportunity to reflect upon who and what has led me to reach the position I’m in today, working as a software developer alongside the superb Research IT team here at the University of Bristol. Perhaps it’s somewhat of a cliche, but probably my parents were most influential, providing lots of early guidance in the direction of science and technology.
My father was a research chemist who worked for a major pharmaceutical firm of his day, authoring papers on penicillin amongst other topics. Although he left school at 15, he continued his education at night school, eventually gaining a first class degree in chemistry. He was unfailingly encouraging of all my educational efforts while I was growing up.
My mother was the daughter of two Polish academics, both agricultural scientists. A couple of her formative years were spent in Siberia following the Soviet invasion of eastern Poland at the start of WW2. My grandmother’s background made her the ideal candidate to be put in charge of the livestock in the little village where they were placed, and my mother used to describe how their hut was shared with pigs and other village animals, which were brought indoors in winter and overnight. It was maybe as a result of her experiences there that she was always vocal about the value of scientific knowledge when life gets ugly.
Although my mother worked in the pharmaceutical industry for a while before my brother and I were born, my childhood memories of her are as the physics lab technician at the local secondary school. She gave that job her all and did it exceptionally well, often going “above and beyond”. I recall electronics being introduced to the curriculum, something she didn’t know much about, and so she took herself off to local adult education classes to study it until she had a solid understanding of it. The value of that knowledge was not to be underestimated.
Returning to IT, my first experience of this was our family’s BBC Micro Model B computer. Although I say it belonged to the family, really it was the domain of my older brother and his school friends. However, I did get a reasonable number of opportunities to try out the various games available (Chuckie Egg was my favourite!) and the “music” of loading them up from cassette tape is forever etched on my memory.
I gained more substantial experience when I embarked on a degree at Leeds University in the early 1990s, where computer science formed a third of my course for the first two years (together with maths and music). We were taught to program – I recall that Pascal, SML and C++ were on the curriculum at that time – and the buzz of typing logical, structured words into a terminal, and seeing it doing something cool in response, is something which has stayed with me to this day. Although I focussed more on maths for a short while longer, the lure of programming was never far away, and I started my first job doing that shortly before 2000.
A good proportion of my career has been spent writing code for and working with various flavours of mobile devices, from Pocket PC, Palm Pilot and Symbian, through to Blackberry and then Android. I’ve been able to draw on that when working on the SAFER PREPARED project here at the University, where Prof Anastasios Sextos has developed methods to evaluate the safety of buildings in countries prone to earthquakes. With a series of questions coded into an Android application, it is quick and easy for field engineers to inspect and photograph a building, and to upload and store this information centrally; a straightforward scoring mechanism then provides guidance to the appropriate authorities on which areas are most in need of attention and support.
I am a Research Software Engineer in Research IT at the University of Bristol and have worked in IT for over 20 years.
I found a love of coding while taking A-level Computing.
I come from a web background, from streaming real time market data to early browsers in the early 00s through a journey of an open source developer in government, charity, and education sector roles.
I have always been driven to make tools to help others share their message and now specifically research.
I have always been supported not pressured and encouraged to do my best.
I have been surrounded by intelligent strong women my entire life and I dedicate this post to all of them.
How team manager Serena Cooper ended up in IT and her thoughts on how we can support our female colleagues.
I started with the Research IT team in May 2020 during lockdown. I love this job as it brings together my background in research with my experience managing IT teams as well as my desire to use IT to do good. I am proud to say I am a feminist, a strong independent woman who has had some excellent role models and advocates. My journey into IT was the long way round with a bit of avoidance along the way.
I grew up surrounded by computing, my father was a computer engineer and my mother a programmer when computers filled rooms and code was made by punching holes in bits of paper. Programming and hardware were normal dinner time conversation and my two brothers absorbed it like sponges. I, on the other hand, found it boring and lacking in creativity. After briefly considering becoming a scientific illustrator, I pursued a career in biochemistry. I ended up in the computationally heavy area of protein X-ray crystallography and, although I worked alongside the CCP4 Team at Daresbury Labs, I was a user of IT and not a contributor.
X-ray crystallography was wonderfully female discipline not just with its big-hitter heroes like Dorothy Hodgkin, Olga Kennard and Rosalind Franklin but also the continued strong presence of women and how normal and expected that was. It was a stark contrast to the host chemistry department where even in the mid-90s there was not a single female lecturer. I always remember a colleague contemplating a temporary lecturer post being worried she would get all the pastural work and didn’t want the feeling of pressure of being the “first one”. That particular department is doing slightly better, a quick look at their website now and I see they have six female lecturers!
Messing around with high energy X-rays, liquid nitrogen and high-end graphics was fun, but the day-to-day reality was of pipetting small amounts of liquids in a damp cold-room, of lack of results, and of a strong personal feeling of being an imposter. So, in a turn to the side, I joined the Research Councils as a portfolio manager, and it is here through various good managers I lost my imposter syndrome and made the slow slide into IT.
I was recognised by the formidable Jo Booth Davey as someone who could articulate user needs in a way the “techies” understood. All those years of being in a vaguely IT literate environment had paid off! Jo was EPSRC’s software development lead and, like a great general, inspired not a lfear but much loyalty, said it as it was, took no nonsense and got things done. She was a massive influence on me and a fantastic advocate and mentor, not least because I decided I liked the look of what she did and wanted her job! Five years later when she retired it became a reality.
Whilst my particular journey has included a lot of fantastic female colleagues, IT is still male dominated. As I have moved along, I try to be a good peer and mentor and give back the encouragement, advocacy and support I received and still receive. I have also had, and taken, opportunities for female-centred training and support and would encourage others to do the same.
Through those past advocates I have gained the confidence to speak up when I see unfairness or issues that need to be addressed. IT will only change with visible role models, if recruitment is less to a type and support given to those entering teams as “the first”. Those who can must be supportive of those who don’t – yet – have confidence, and highlight all the undesirable behaviours or situations for the continuing benefit of all.